
Surface · Map
One journey model. Four ways to read it.
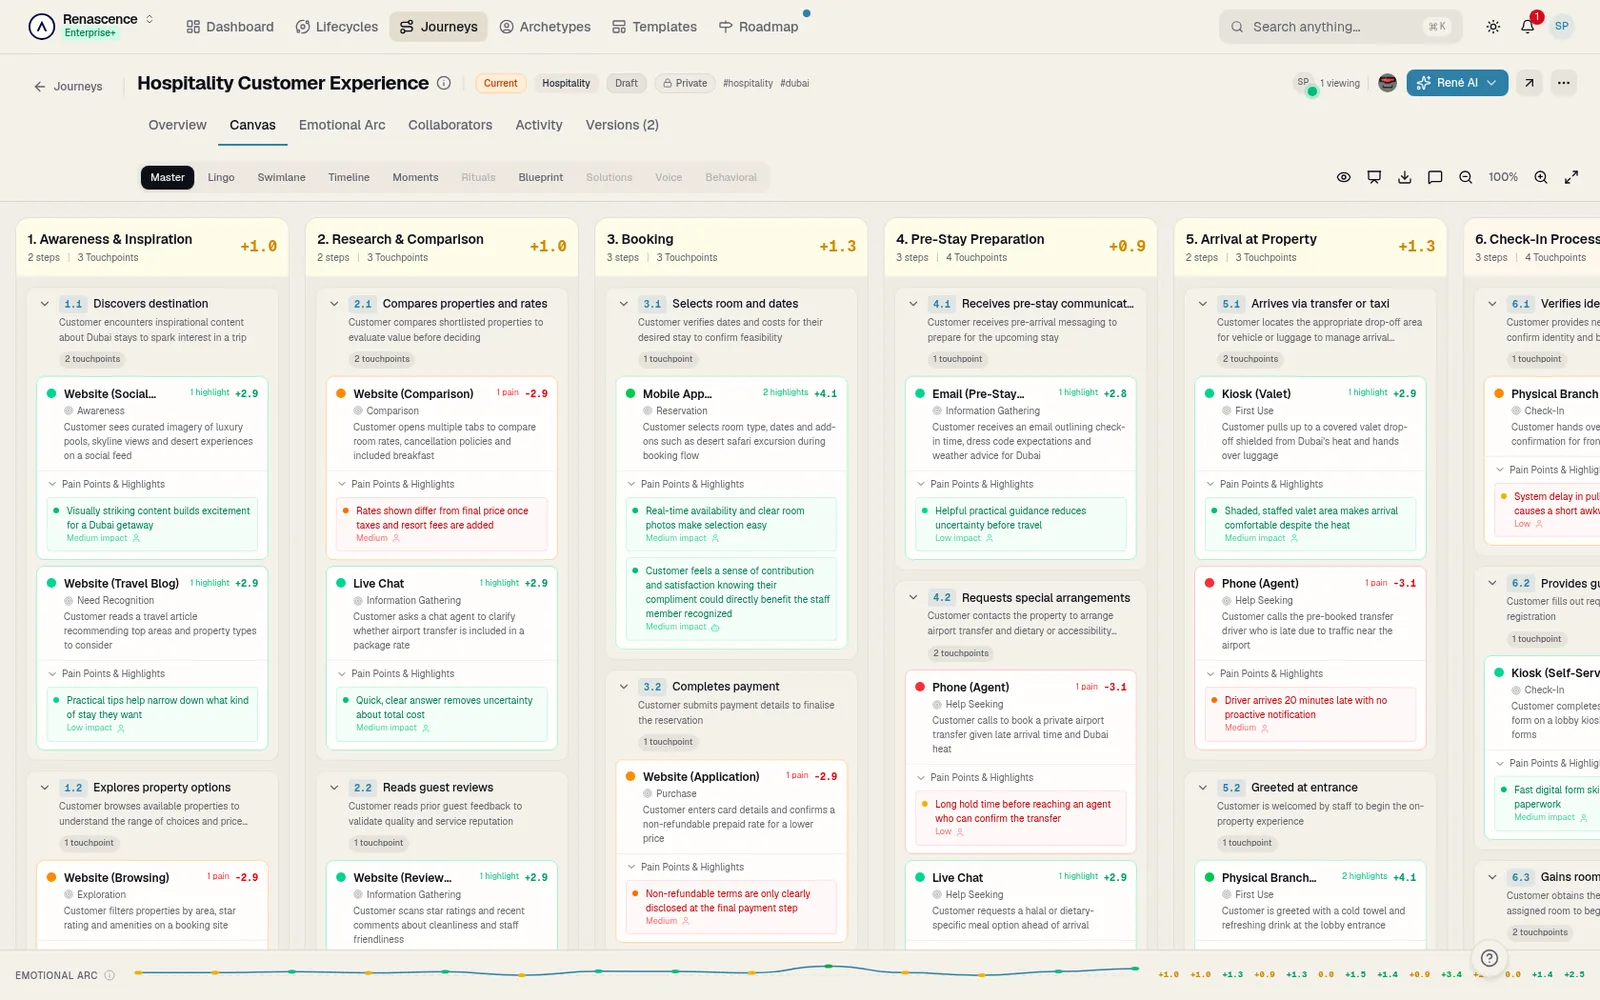
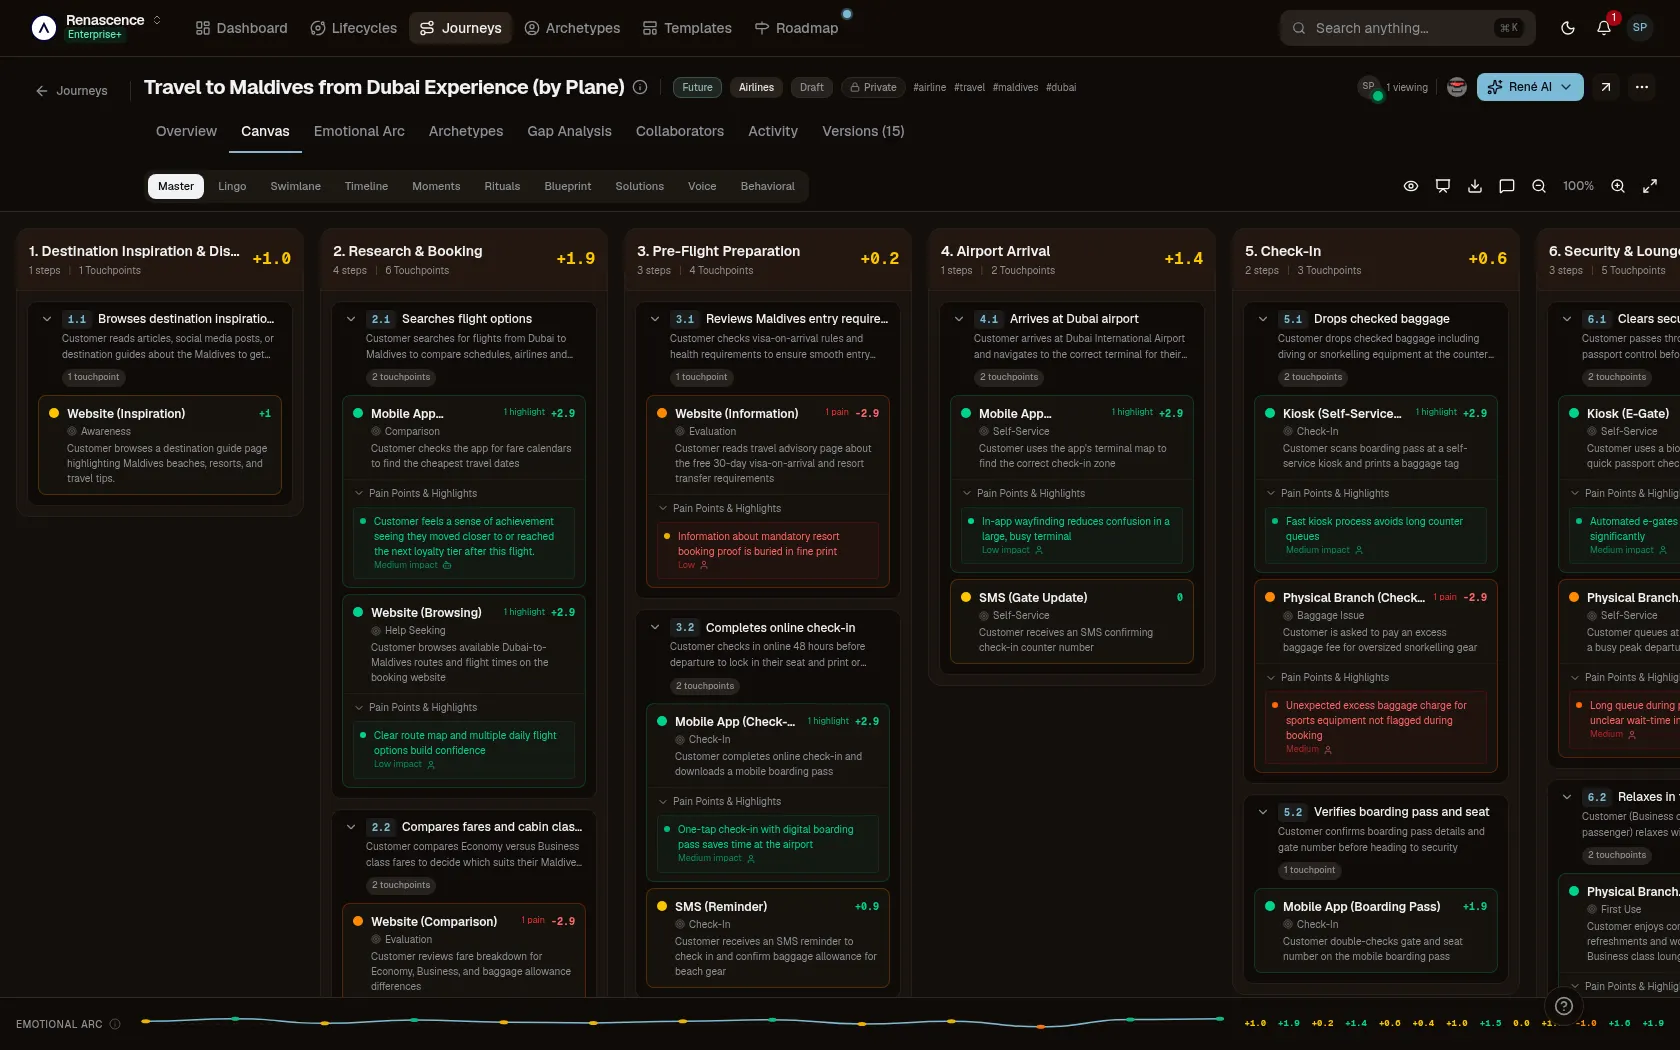
Build the journey once. Read it as stage columns, as service swim-lanes, as a coverage matrix or as an emotion curve — each view rendered from the same underlying data.
Product · Journey Canvas
Columns
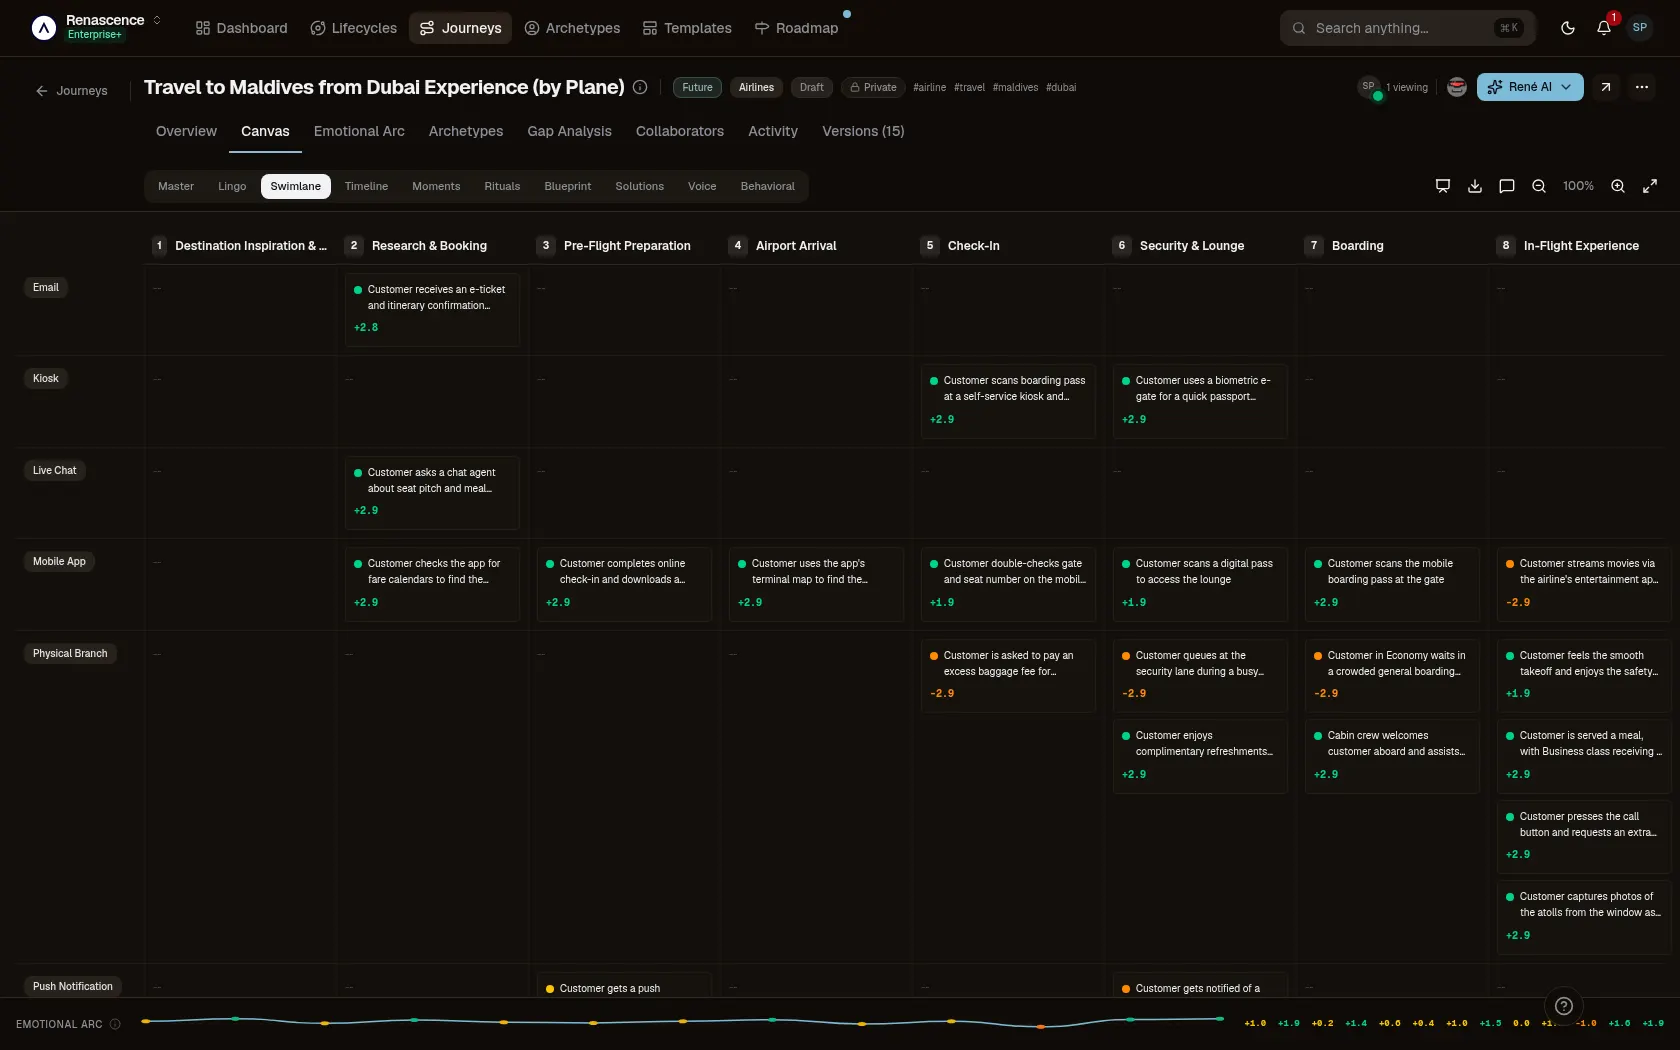
Swim-lanes
Matrix
Emotion curve
The problem
A drawing cannot be re-read. A model can.
Whiteboard maps store shapes. Change the audience and you redraw. Change the data and the drawing quietly becomes wrong, with nothing to tell you it happened.
- Each stakeholder audience needs a different rendering of the same journey
- Updating one view leaves the others stale
- Evidence gets detached the moment the map is exported
The answer, on screen
Journey Canvas as it ships
Journey CanvasRené workspace
Specification
Views per model4
Stages per journeyUnlimited
Archetype branchesPer journey
Version historyFull, with diffs
What it does
6 capabilities01
Stage columnsThe default working view: stages, touchpoints, pains, gains, owners.
02
Service swim-lanesCustomer, frontstage, backstage and systems against the same stages.
03
Coverage matrixTouchpoint by stage, showing where you have presence and where you do not.
04
Emotion curveThe board view: one line, the moments of truth marked.
05
Attached evidenceVerbatims, tickets and clips linked to the stage they describe.
06
VersioningNamed versions with diffs, so decisions trace to the map behind them.
In the product
The whole journey on one board
Grouped by channel
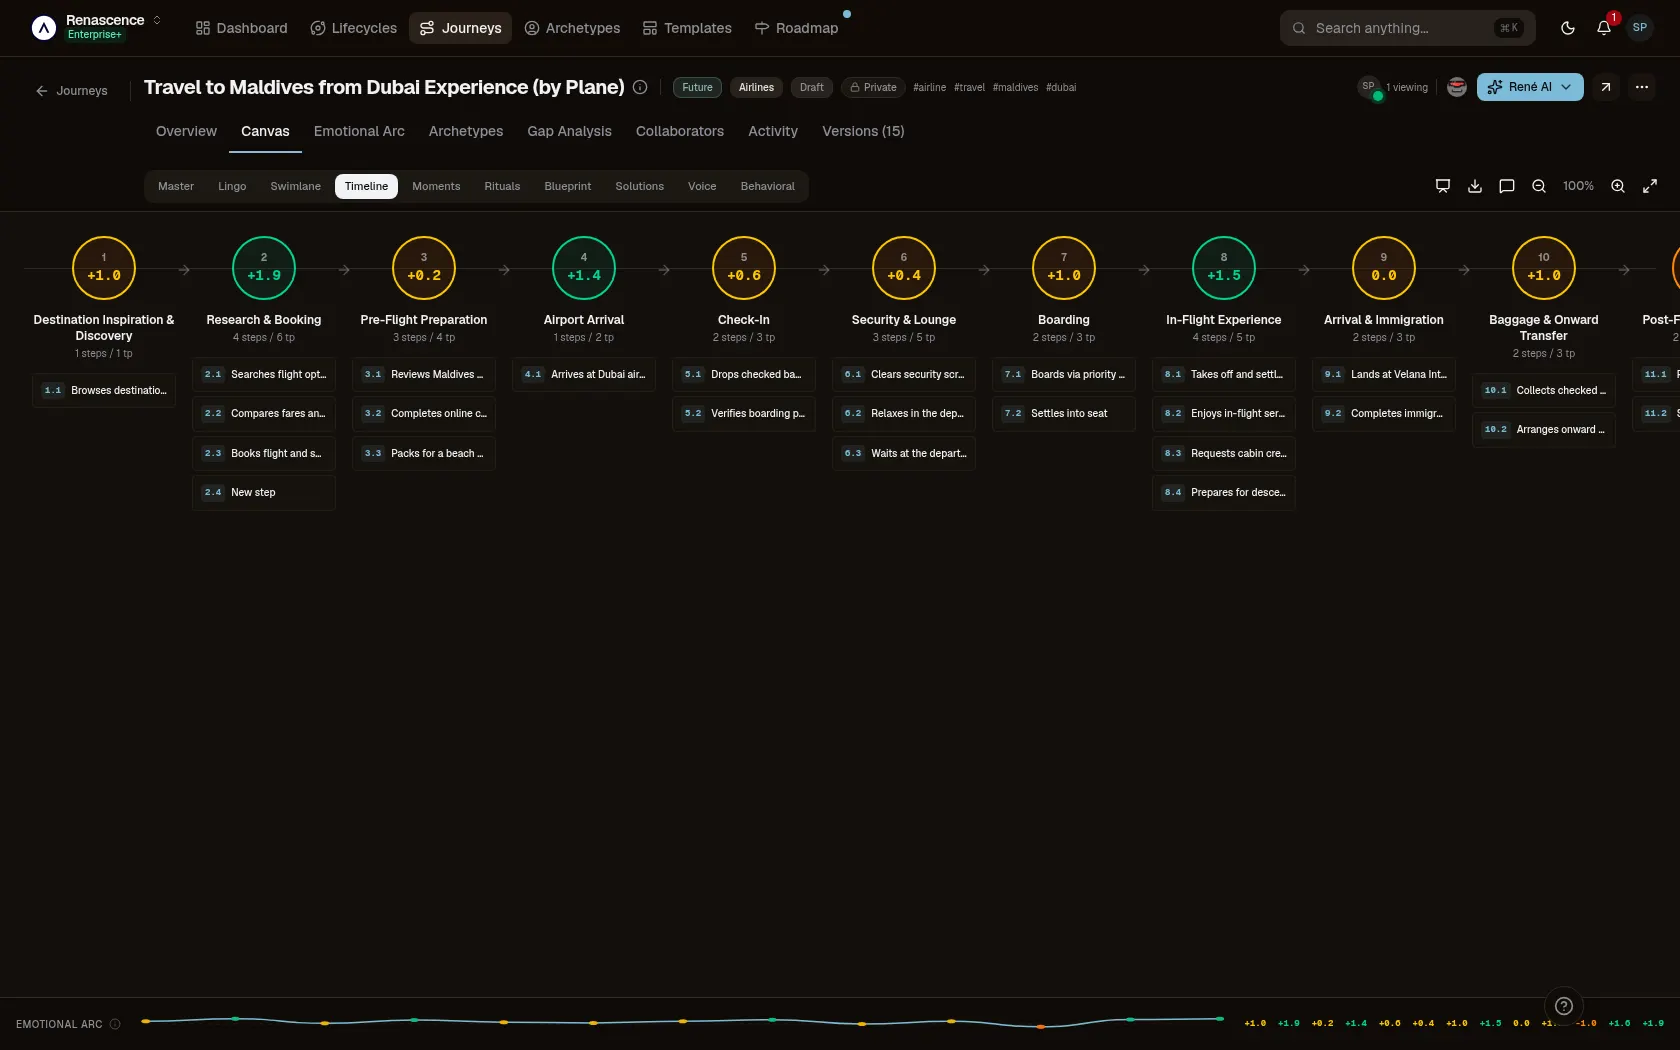
The sequence at a glance
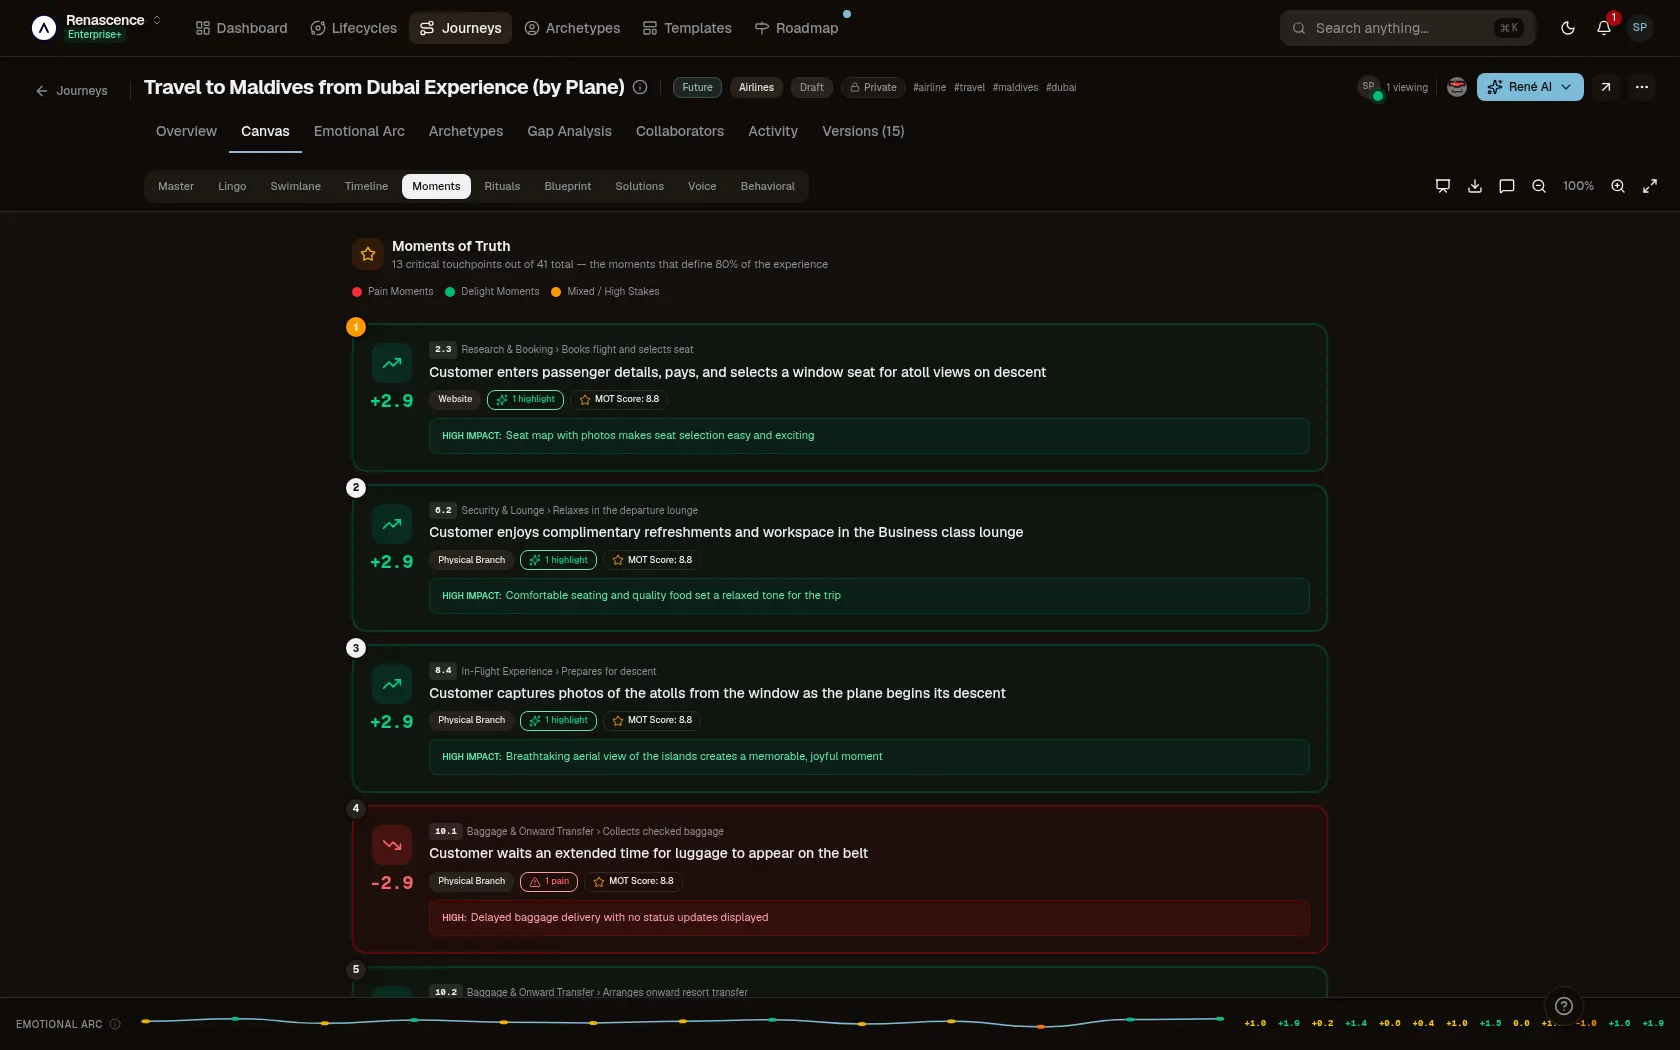
The moments that decide it
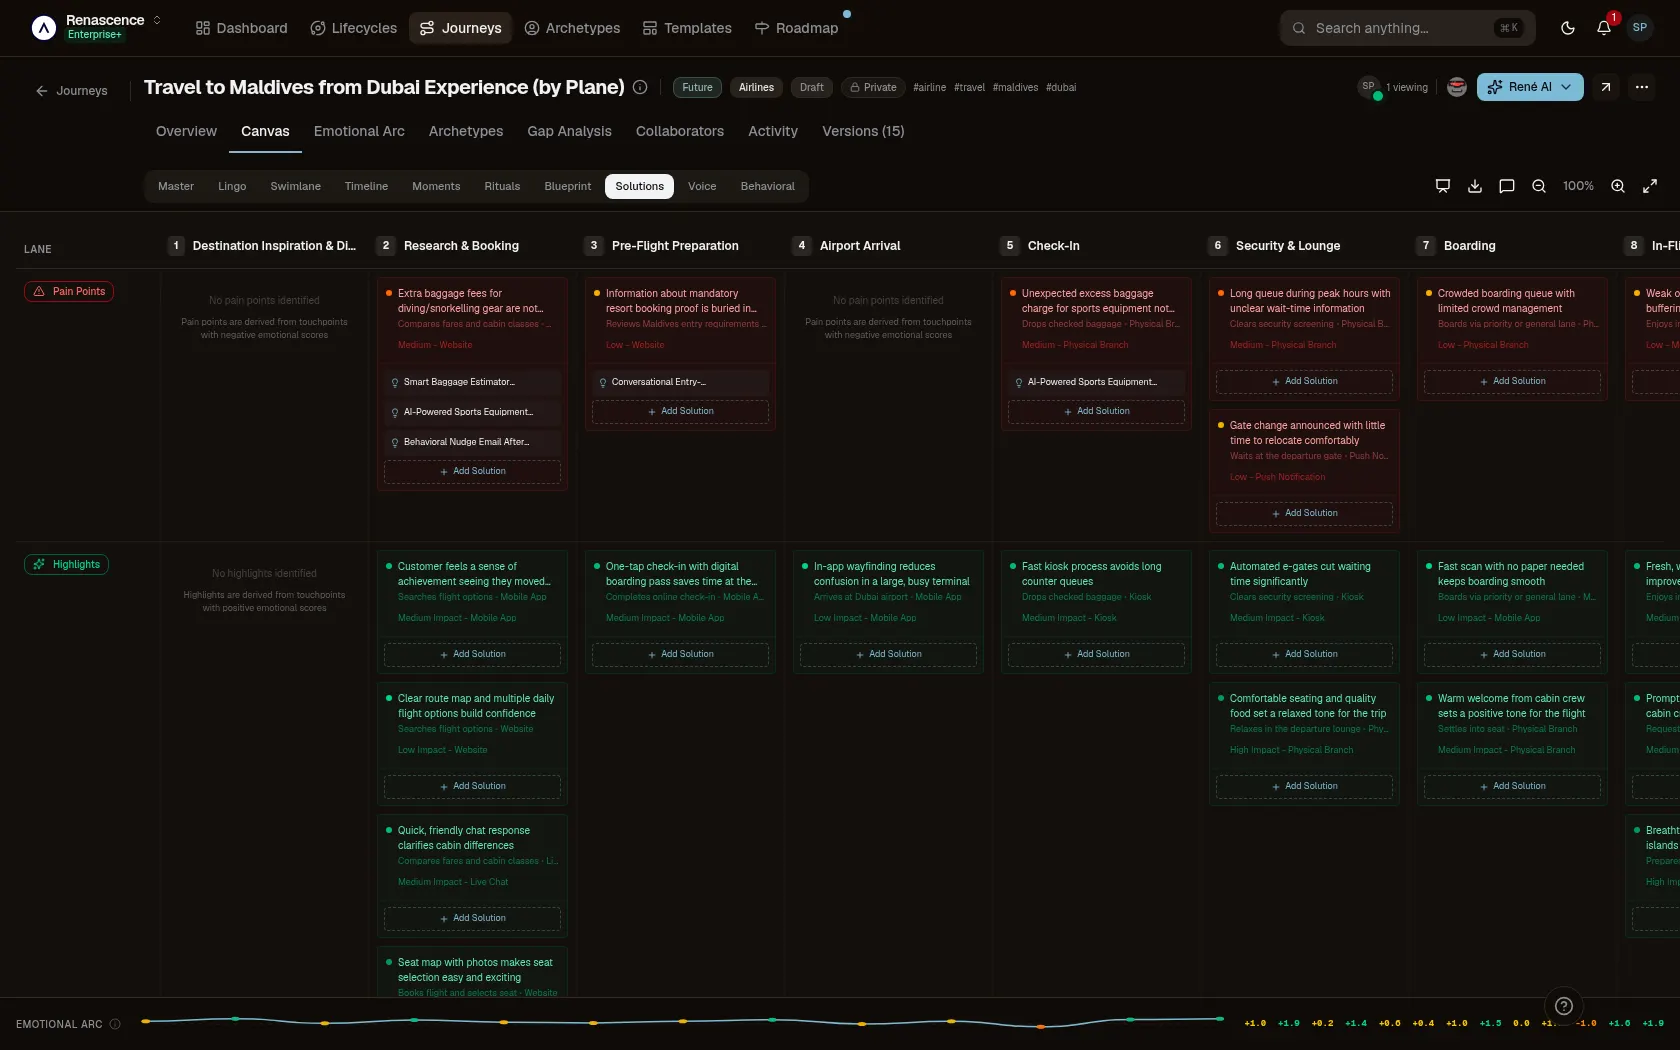
Fixes, sized and reasoned
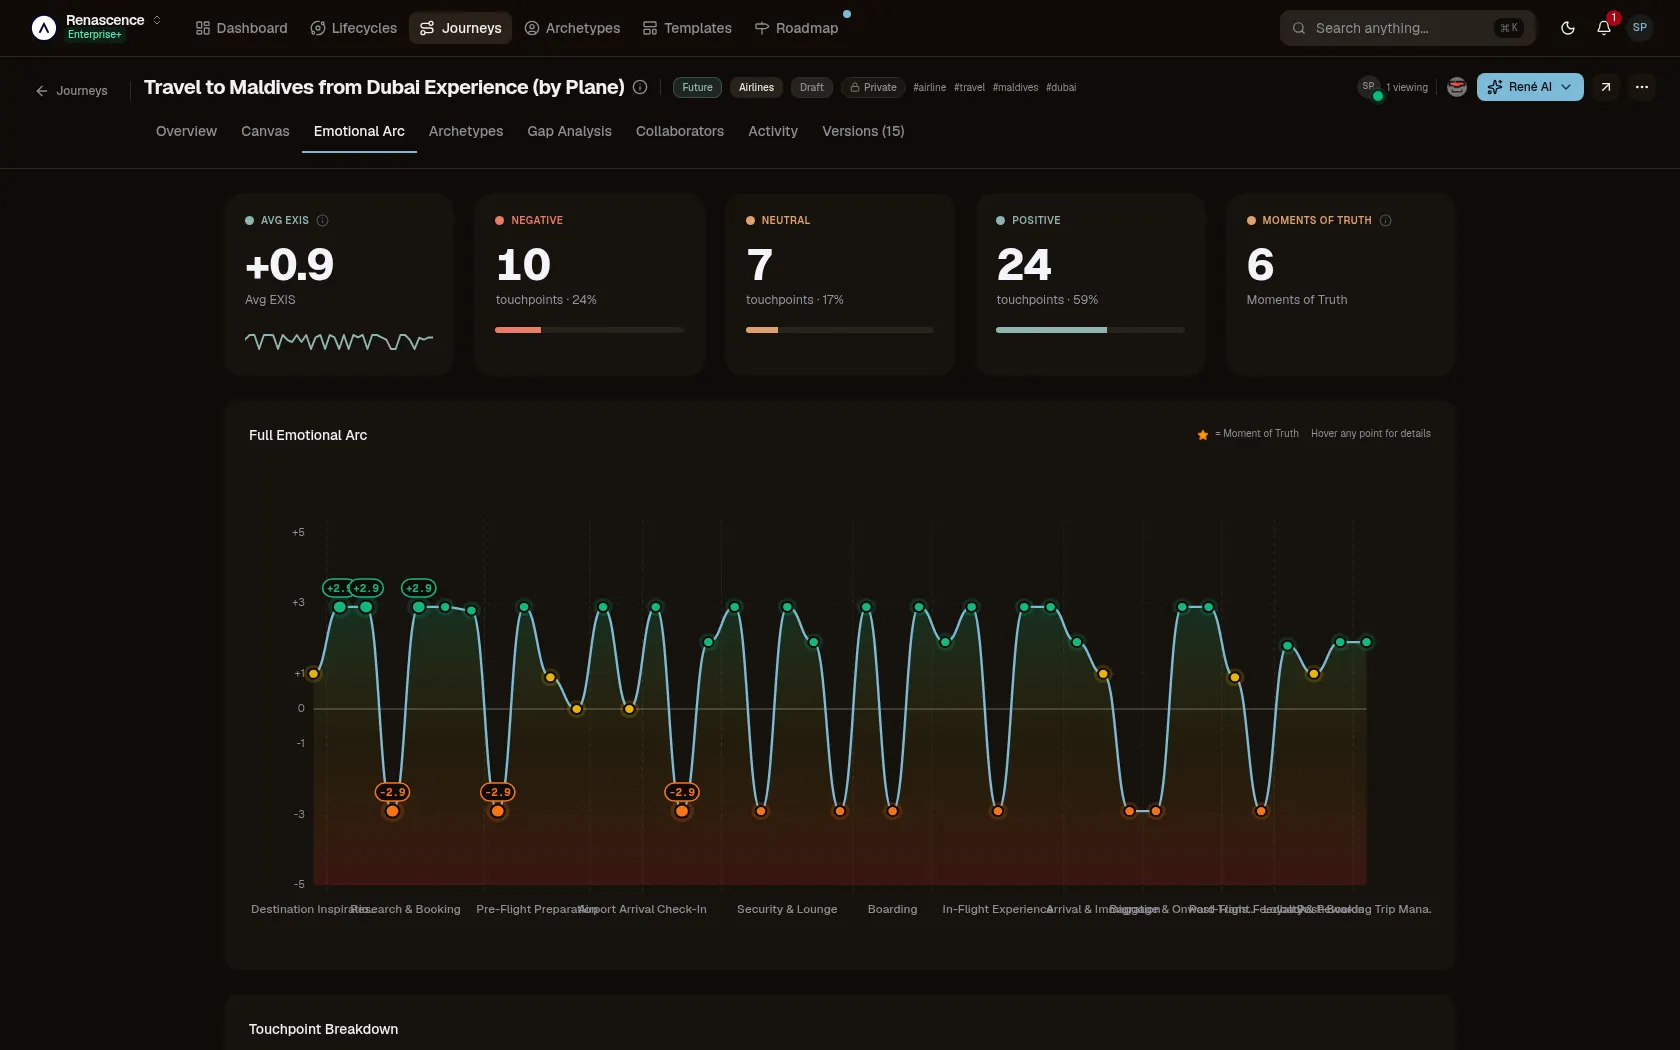
Emotion, scored stage by stage
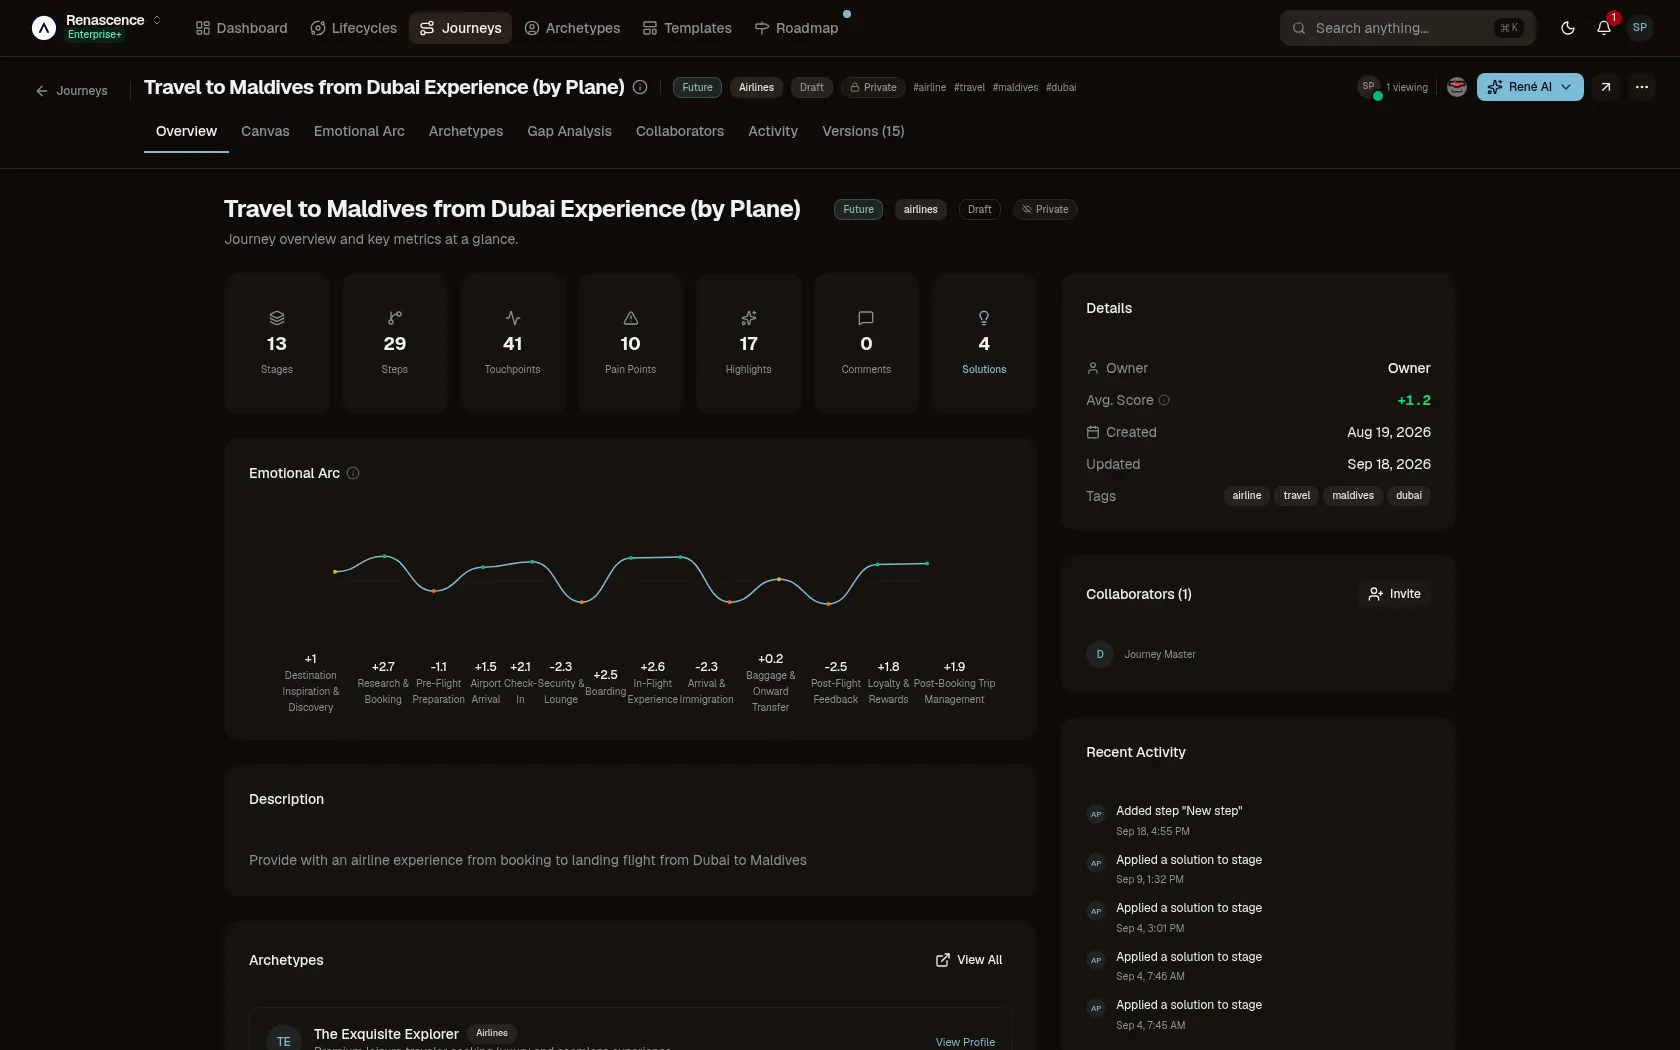
Every journey, measured
Against a whiteboard
TodayWith René
Stores a drawingStores a model
Redraw per audienceRe-render per audience
Evidence in another toolEvidence on the stage
Questions we get asked
That is the intended use. The same journey moves from blueprint to emotion curve without a rebuild, which changes how the conversation runs.
Make one journey measurable this week.
Start with the journey that costs you the most. Free plan, one journey, all four views — no card, no call.
Or talk to the Renascence team about an enterprise evaluation.